Loading…
THE PROBLEM
Your stock is in the wrong stores
Size 7 sells out in Sandton but gathers dust in Pretoria. By the time anyone notices, it is markdown season. Manual rebalancing via spreadsheets and phone calls misses profitable moves every day. The tools that exist are either enterprise-priced, generic, or black boxes that tell you what to do but never why.
Replenify finds every profitable move across your network — and proves exactly how much each move made you. Not projections. Measured outcomes in actual profit.
HOW IT WORKS
The 3-pass architecture
Each pass builds on the last. 17 blocking analysis stages ensure every move is justified — or explained why not. Every SKU that does not move gets a reason code. No black boxes.
Pass 1
Warehouse Push
Get new season stock to the stores with demand — not uniform distribution. Prioritizes sell-through velocity and broken size ranges so your highest-performing doors get stock first.
129 moves generated
Pass 2
Inter-Store Balance
Move stock between stores based on actual sell-through, not gut feel. Distance-aware routing keeps freight costs profitable — JHB to Cape Town at R200-500/box only happens when GP uplift exceeds transport cost.
1,443 moves generated
Pass 3
Sweep & Consolidation
Clean up broken size runs. Reconstitute sellable ranges. Consolidate fragments into full offerings. A bin-packing algorithm sweeps fragmented stock across regional clusters so customers find what they need.
Regional consolidation
PRODUCT TOUR
Inside the platform
app.replenify.io
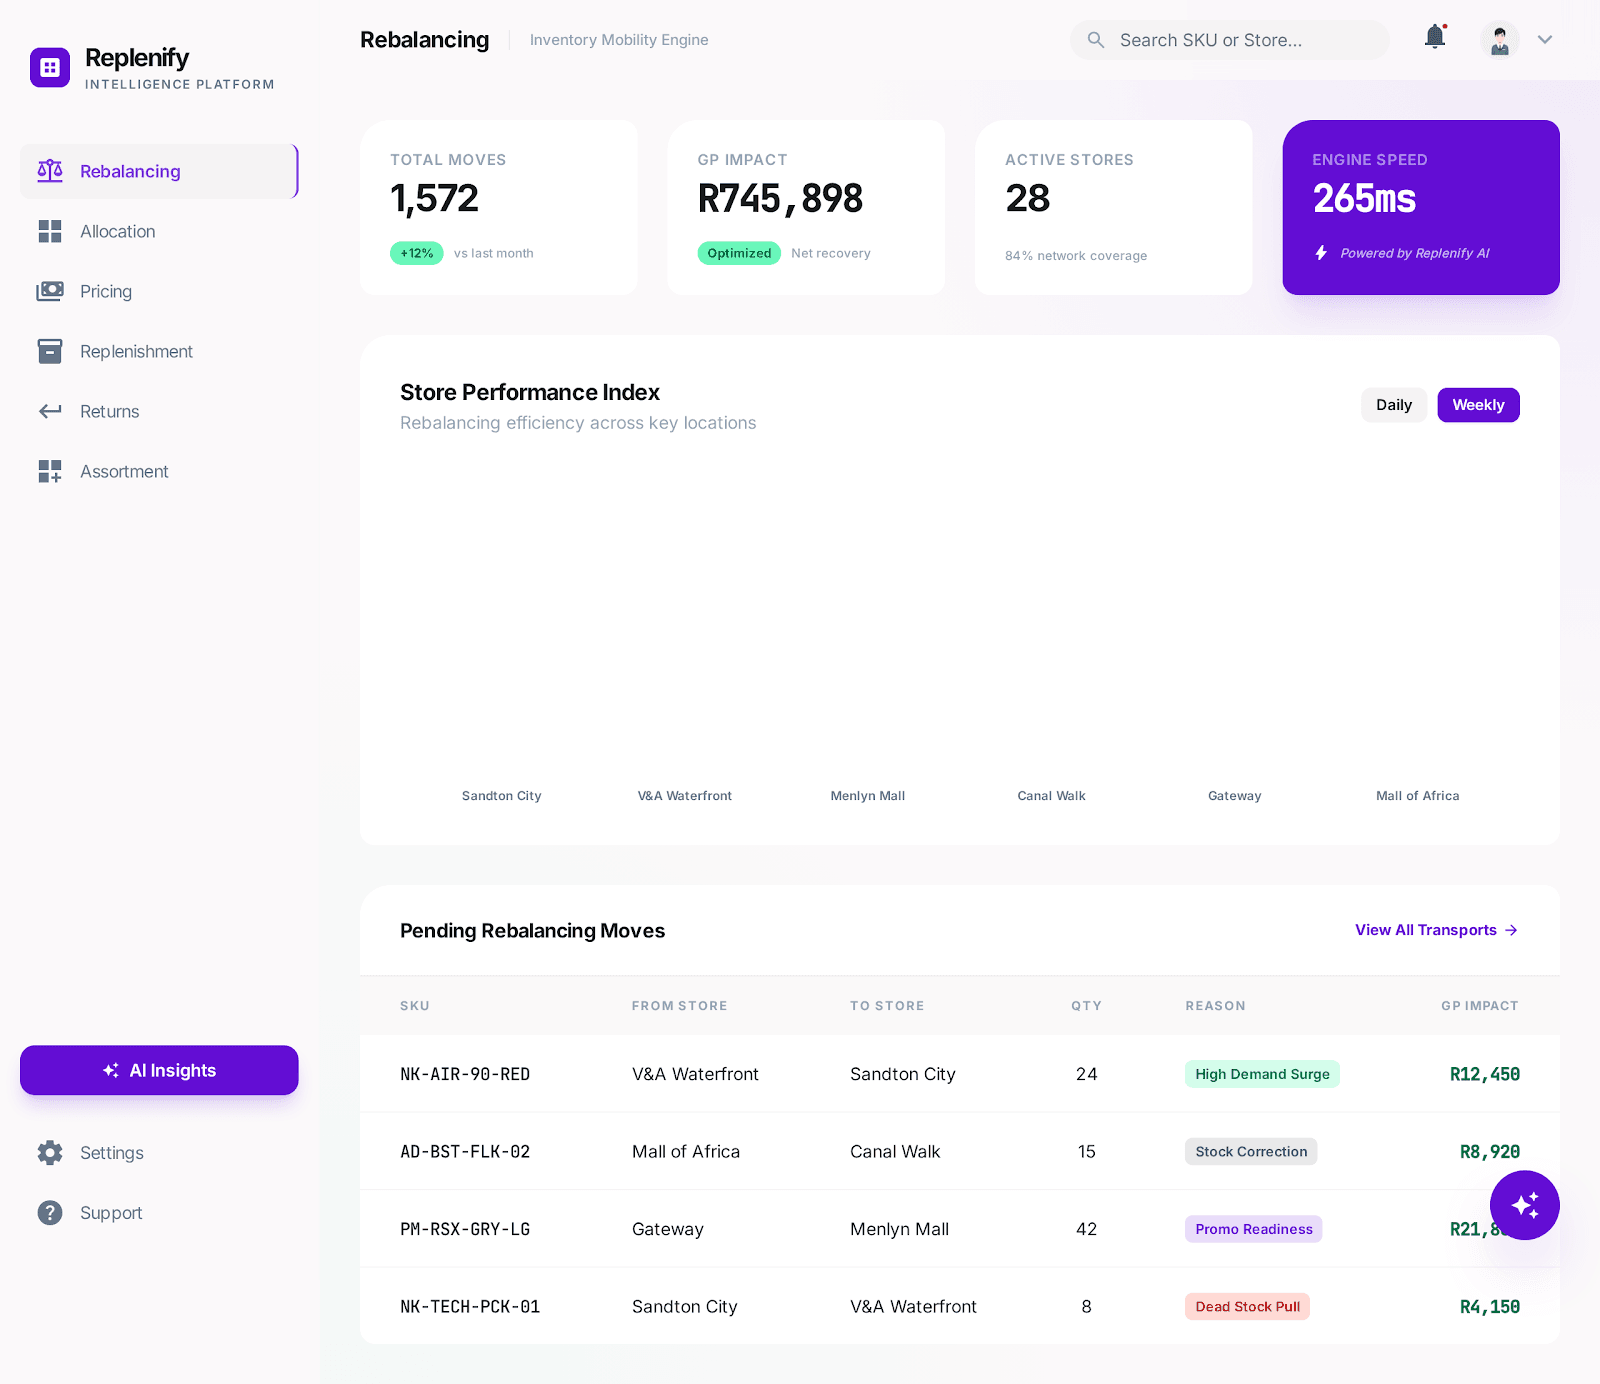
Pulse Dashboard
Real-time overview of engine performance and GP impact across your entire store network. Every metric is measured, not modeled.
app.replenify.io
Total Moves
1,572
GP Impact
R7m
Stores Affected
28
Engine Time
265ms
GP Impact by Pass
P1
P2
P3
Rebalancing
Allocation
Pricing
Moves Table
Every stock transfer recommendation with full reasoning and projected GP impact. Category managers see exactly what moves and why.
app.replenify.io
| SKU | From | To | Qty | Reason | GP Impact |
|---|---|---|---|---|---|
| NK-AF1-BLK-42 | PTA Central | Sandton City | 8 | DEMAND_VELOCITY | R2,340 |
| AD-UB22-WHT-40 | Warehouse | V&A Waterfront | 12 | BROKEN_RANGE | R4,128 |
| NB-574-GRY-39 | Menlyn Mall | Gateway | 5 | STOCKOUT_RISK | R1,875 |
| NK-DUNK-RED-44 | Canal Walk | Eastgate | 6 | DEMAND_VELOCITY | R3,210 |
| PU-RS-X-BLK-41 | Warehouse | Mall of Africa | 15 | SIZE_RUN_FILL | R5,625 |
Move Detail — “Why this move?”
Every recommendation comes with a full explanation. 17 blocking analysis stages mean every SKU that does not move gets an explained reason. No black boxes.
app.replenify.io
NK-AF1-BLK-42
ApprovedFrom
PTA Central
To
Sandton City
Why this move?
- Sandton sell-through 3.2x higher than PTA for this SKU
- PTA has 14 units, 2.1 weeks of cover. Sandton has 0 units.
- Freight cost R45/box. GP uplift R2,340. Net positive R2,295.
- Completes broken size run at Sandton (was missing 42).
GP Impact Dashboard
Closed-loop measurement proves exactly how much each move made you. Not projections — measured outcomes in actual profit.
app.replenify.io
Total GP Uplift
R7m
Verified closed-loop
Avg GP per Move
R474
Across 1,572 moves
ROI Multiple
18.7x
On subscription cost
TECHNICAL DEPTH
What Replenify does
3-Pass Architecture
Warehouse→retail push, inter-store balance (distance-aware), sweep & consolidation. Each pass builds on the last.
17-Stage Blocking Analysis
Every SKU that doesn't move gets an explained reason. 37 blocking reason codes — full transparency.
Consistent, Repeatable Execution
Same input = same output, always. Every decision has an audit trail. No black box.
Distance-Aware Routing
Minimizes freight cost. JHB to Cape Town = R200-500/box — naive rebalancing ignores this.
Broken Range Cleanup
Reconstitutes sellable size runs. Fragments become full offerings.
Regional Consolidation
Bin-packing algorithm sweeps fragmented stock intelligently across regional clusters.
VALIDATED RESULTS
Pilot results: 28-store footwear retailer
Real data from a real footwear retailer. Not projections, not simulations — measured outcomes from production runs.